Make transportation wonderful and you solve so much more.
When people hear “transportation,” they often picture cars and traffic. In reality, transportation is about something more fundamental: how we arrange our lives in space and how we and the things we need are situated and move through that space. It is about where homes, jobs, schools, parks, and shops are located, and how safely, affordably, and easily people can reach them.
Make transportation wonderful and you solve so much more. If places are walkable, bikeable, transit-oriented, and free of traffic danger, we will not only deeply reduce greenhouse gas emissions, but do so much more. We also address housing, health, inequality, isolation, public budgets, and our relationship with nature. We improve everyday life for everyone.
That is why transportation, understood together with land use, really is at the center—often invisibly—of everything.
Some background
Distribution, distance, and energy
Many of society’s biggest challenges share a simple underlying question: where are things, and how do people reach and connect with them?
Questions about affordability, access, and opportunity often come down to this physical distribution problem. Can people afford to live near where they work? Can children reach school safely? Can older adults and people with disabilities reach healthcare and groceries without depending on someone to drive them? Can goods and services move efficiently through a city?
All of this depends on locations and connections, the basic geometry of our towns and cities.
At the heart of that geometry is energy. Moving people and goods takes energy. As distances grow and speeds increase, energy use climbs rapidly. Physics is not gentle here. Air resistance grows much faster than speed and therefore demands rise very quickly as you approach highway speeds. So spreading things out and then linking them with fast driving is inherently energy hungry and expensive.
This high energy use shows up in many ways. Families pay more for fuel, vehicles, and maintenance. Governments pay more to build and maintain roads. Everyone loses time in traffic. The environment absorbs the impact in the form of pollution and greenhouse gas emissions.
Limits of the private car
In much of the United States, the default assumption is that any adult who wants to get anywhere will drive. Over time this has turned the private car into a kind of monopoly transportation system. This was not destiny or culture alone. It was the result of many policies and investments that made almost every other option harder or less attractive.
Even before we talk about fuels, there is a basic inefficiency in using a heavy vehicle to move a single person. Most of the energy goes into moving the metal, not the human. Most trips involve only one occupant. On top of that, manufacturing and maintaining large fleets of vehicles and the pavement they require consumes enormous amounts of materials and energy.
Electric vehicles improve efficiency and reduce tailpipe emissions, but they do not fix the underlying geometry. Cities cannot function well if every adult is in a car for every trip. There is not enough space on streets or at destinations to store that many vehicles. Even if those vehicles were silent and clean, the sheer volume of traffic would still clog roads and devour land.
Road widening does not solve this. For decades, researchers and planners have documented induced demand. When a road is widened, traffic may ease for a short time. Then people adjust, making more trips, traveling at different times, moving farther from work, or choosing to drive instead of taking another mode. Development follows the expanded road. In the end the new lanes fill up and congestion returns, often worse than before. The financial and energy costs rise while the benefits fade.
Inseparability of transportation and land use
Transportation is not just about vehicles and roads. It is inseparable from land use, which shapes how far apart our daily destinations are. Zoning rules, housing policies, and development patterns determine whether homes are near jobs, schools, and services, or separated from them by long distances.
Low-density sprawl that separates housing, offices, and shopping forces long car trips. A compact neighborhood that mixes homes with workplaces, schools, shops, and parks allows short trips and real choices about how to travel. When we talk about fixing transportation, we are really talking about reshaping both the network of movement and the pattern of places.
Car-centrism not a natural evolution but rather a product of political choices
Many people assume that Americans just love cars more than people elsewhere, and that this explains our landscape. The story is more complicated. Over many decades, governments and institutions made choices that favored driving. Zoning separated land uses. Minimum parking requirements surrounded buildings with large parking lots. Highways were built through city neighborhoods. Financial incentives favored new development on the edge over reinvestment in older areas. Transit and sidewalks often received far less funding and attention.
Each step seemed practical at the time, but together they built a system where driving is the only workable option in many places. Once that pattern was in place, it created a powerful path dependency. The easiest political decisions were often the ones that reinforced the existing car-based system.
The hopeful side of this history is clear. If policy and design decisions created our current pattern, new decisions can create a better one.
A list of benefits that happen when transportation serves everyone
If we focus on creating more compact towns and cities, with good transit, safe walking and biking, and less dependence on private cars, we set off a chain reaction of benefits. These places are structurally more energy efficient and make electrification more affordable and effective.
1. Real new freedom and savings
In a well-connected, multimodal place, people gain more choices. Buses, trains, safe bike routes, and good sidewalks offer real alternatives to driving for many trips. Shorter distances make these options practical.
Households can own fewer cars or sometimes none at all. They spend less on gas, insurance, repairs, and parking. They waste less time in traffic and on long commutes. Many daily trips can become short, pleasant walks or rides, instead of stressful drives.
This can also bring more joy and autonomy. Teenagers can reach school, jobs, and activities without relying on parents. Adults can choose how to move based on what feels best for a given trip, not just on what is mandatory. People can live more spontaneously, not organized around congestion peaks and parking searches.
2. Housing where people need it
When transportation planning supports transit-oriented development and compact growth, more homes can be built near the places people need to go. Infill and “middle housing” types, such as duplexes, fourplexes, and small apartment buildings, can fit into existing neighborhoods and add new neighbors without overwhelming the area.
This combination of compactness and variety helps in two ways. It increases the overall supply of homes in high-opportunity areas and it lowers the transportation burden of living there. When people can live closer to work and services, total household costs, including transportation, can fall even if rent or mortgages are not the lowest in the region.
3. Greater independence and healthy lifestyles
A car-only system quietly excludes many people. A large share of the population cannot reliably drive, including youth, many older adults, people with some disabilities, and people who cannot afford a vehicle or insurance. When driving is the only option, they are cut off from opportunity and even from basic daily needs.
Walkable, bikeable neighborhoods with good transit change that pattern. They give independence to people who might otherwise be stranded. A teenager can bike or ride a bus to an after-school job. An older adult can take a frequent, accessible bus to a clinic. A person with a disability can reach work by a predictable, barrier-free transit system.
These places often support more active lifestyles as well. Walking to a corner store or cycling to a friend’s house builds movement into ordinary days. Over time, this helps counteract the health impacts of sedentary living.
Access to transportation is also a major ingredient in economic mobility. If people can reach training programs, jobs, and childcare without needing to buy and maintain a car, they have a far better chance to move ahead.
4. Less precarity and less financial stress
Housing and transportation costs draw from the same household budget. In car-dependent areas, many families face a hard choice. They can live farther out and spend heavily on fuel and multiple vehicles, or they can pay more for housing closer in. Either way, budgets are stretched.
Compact, well-served neighborhoods reduce this bind. They make it possible to live closer to jobs, schools, and services while needing fewer vehicles, if any. Even when rent or mortgages are somewhat higher, overall costs can be lower, because transportation expenses fall.
This is especially important for people living close to the financial edge. If essential services, food, healthcare, and social supports are reachable without a car, the risk of missing appointments, losing jobs, or falling further behind is reduced. People experiencing homelessness also benefit when shelters, clinics, and outreach programs are accessible by foot or transit, instead of scattered in remote, car-only locations.
5. More livable, joyful neighborhoods
When streets are designed around people rather than just vehicles, they become more than traffic corridors. They become places to live, meet, and linger.
Slower vehicle speeds, clear crossings, continuous sidewalks, and protected bike lanes make it safer and more pleasant for people of all ages to move around. Parents feel more comfortable with children walking or biking. Older adults can navigate their neighborhoods with confidence. Everyday errands can become moments of fresh air and social contact.
With more people on the street and fewer cars rushing through, neighbors see one another more often. Small interactions accumulate into real social bonds. Quieter streets with cleaner air and more trees are more restful for people who live and work along them, even when they are not traveling.
6. Resolution of unsheltered homelessness and disorder in public space
Unsheltered homelessness often appears most visibly in public areas, such as sidewalks, parks, transit stops, and bike paths. This problem is rooted in housing and social services, but transportation and land use play an important supporting role.
When regions create clear, humane strategies to bring people indoors and connect them with services, transportation planning must be part of the solution. Shelters and supportive housing need to be placed where people can reach them by transit, walking, or services that use the existing street network efficiently. Public spaces, including transit stations and trails, need to be designed, maintained, and managed in ways that are welcoming and safe for everyone. That includes people who are housed and currently unhoused.
Taking responsibility for these connections can reduce the pressure on transit systems and bike networks to function as informal shelters. It can also help ensure that public spaces remain accessible and comfortable for both daily users and vulnerable residents.
7. Tackling bike theft
As more people choose to bike, cities must confront bike theft in a serious way. Reliable cycling networks need reliable parking and protection. That means secure bike storage at stations, workplaces, and major destinations, along with good lighting, natural surveillance, and clear management practices.
Stronger systems for bike registration and recovery, combined with consistent enforcement, can also help. When cities treat bikes as important vehicles, not disposable accessories, people are more willing to depend on them for daily mobility.
8. Fuller disaster preparedness
Climate change is driving more frequent and severe disasters, including floods, fires, storms, and heat waves. In these moments, the structure of a transportation system can save lives or put them at risk.
Car-dependent evacuation plans are fragile. Not everyone has a car. Roads can clog quickly. People with mobility challenges may be unable to leave in time. Compact, transit-rich communities make it easier to plan redundant, inclusive evacuation routes. Distances to shelters and safe zones are shorter. Organized transit and shuttles can supplement or replace private vehicles in emergencies. Emergency services can cover more people in less time.
Planning for disasters in this way requires thinking about people who do not drive or cannot drive reliably, and ensuring that they are not left behind.
9. A healthier relationship with nature
Efficient, compact transportation and land use opens room for more nature in cities and towns. When we do not need as many wide roads and vast parking lots, we can plant trees, create green medians, and line streets with vegetation.
Green infrastructure, such as bioswales, permeable pavements, and rain gardens, helps soak up stormwater and reduce flooding. Trees and plants cool neighborhoods, reduce the heat island effect, and improve air quality. Wildlife and pollinators can find habitat even in dense districts when green space is intentionally woven through the urban fabric.
Using land more efficiently in already developed areas also reduces pressure to convert farmland, forests, and wetlands at the edge of metro regions. That protects biodiversity and carbon storage outside the city while improving life inside it.
10. Lower electricity costs and a more resilient grid
Compact, transit-oriented communities do not just use less energy; they also make it cheaper and more reliable to deliver. When people live and work closer together, utilities can serve more customers with shorter runs of wires, fewer substations, and less equipment spread across difficult terrain. It takes fewer materials and less labor to build, maintain, and eventually replace the infrastructure needed to keep the lights on. Those savings show up over time in lower system costs and, ultimately, lower pressure on rates.
Sprawl pushes the grid outward into low-density areas and the wildland–urban interface. Long radial lines through forests and over hills are more exposed to wind, ice, and fire risk. They are also expensive to patrol and hard to upgrade. As climate-driven wildfires intensify, utilities are forced to spend billions hardening these far-flung networks or shutting them off during high-risk periods, costs that ratepayers absorb.
By contrast, compact development allows more of the grid to sit in shorter, looped configurations within already urbanized areas, where access is easier and vegetation risk is lower. When an outage does occur, crews can reach the fault more quickly, isolate it, and re-route power around it. Fewer people are left without power, and those who are can be restored faster. In this way, the same patterns of land use and transportation that reduce vehicle emissions also enable an electricity system that is cheaper to build, easier to defend against wildfire, and more resilient when things go wrong.
11. Better stewardship of public money
Transportation is one of the biggest items in public budgets. Building, repairing, and policing a very large road network is expensive. Low-density development requires long stretches of pipes, wires, and streets for relatively few people.
Compact, multimodal communities allow governments to serve more residents with fewer lane miles and shorter infrastructure runs. Transit routes can be shorter and more productive. Roads can be maintained to a higher standard when they are not constantly being widened.
By investing in systems that give people real choices and reduce dependence on cars, local governments can get more value from each dollar. They can improve the daily experience for residents while reducing long-term maintenance and operations costs. Addressing root causes, such as long distances and lack of options, is far cheaper than constantly responding to traffic, safety problems, and social crises after the fact.
12. Deep reductions in greenhouse gas emissions
Transportation is a major source of greenhouse gas emissions in many regions. In some rural and semi-rural areas of the United States, it is the single largest source. Cleaner vehicles are important, but they cannot carry the whole burden on their own.
Better transportation and land use policies reduce emissions directly. When people can take shorter trips, drive less, and use walking, biking, and transit more often, vehicle miles traveled go down. That means fewer emissions even before considering cleaner technologies.
Compact, mixed-use development also reduces building-related emissions. Multi-unit buildings tend to be more energy efficient per household than detached homes. Shorter distances also lower the energy required for deliveries and services.
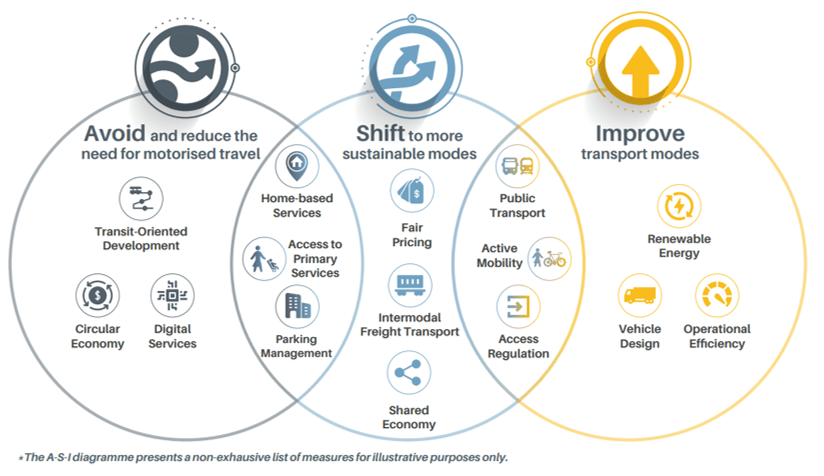
A widely used framework for climate action in transportation is called “Avoid, Shift, Improve.” Avoid means avoiding unnecessary trips or long distances through better land use and digital access. Shift means shifting trips to more efficient modes such as walking, biking, and transit. Improve means improving vehicles and fuels, for example by electrifying fleets and cleaning up the grid.
Land use is central to the “avoid” part of this strategy. Without compact, connected development, we lock in long trips and high energy use, and then we try to fix the consequences at the tailpipe.
A more compact and predictable transportation system also makes electrification easier and cheaper. Transit fleets can be electrified with well-placed depots and chargers. Shorter driving distances reduce range requirements and charging needs for electric vehicles. Grids can be planned around dense clusters of demand rather than stretched thin. Building and transportation electrification can be coordinated as part of one integrated energy strategy.
In this way, transforming transportation and land use does more than cut emissions from cars. It makes the entire project of getting off fossil fuels more feasible.
Transportation as lever for a better future of everything
Transportation is at the center of everything because the way we organize movement and space shapes almost every part of our lives. It influences what we can afford, how we feel, how healthy we are, how strong our communities are, and how well we can respond to climate change.
Make transportation wonderful and you solve so much more. Build places where walking, biking, and transit are safe, dignified, and convenient. Bring daily destinations closer together. Reduce the need to drive for every trip. Support the electrification of everything in a way that is practical and affordable.
Do that, and you do not just lower emissions. You ease financial stress. You expand opportunity. You help people feel less isolated and more connected. You protect nature and public budgets at the same time. You make it easier for everyone, including those on the margins, to meet their basic needs and pursue their goals.
Transportation is not just how we move. It is a powerful tool for building the kind of world we want to live in.
References
IPCC (2023). Climate Change 2023: Synthesis Report. Intergovernmental Panel on Climate Change. https://www.ipcc.ch/report/ar6/syr
C40 Cities & UN-Habitat (2023). C40 and UN-Habitat Urban Planning Accelerator. C40 Cities. https://www.c40.org/accelerators/urban-planning
Creutzig, F., Javaid, A., Soomauroo, Z., Lohrey, S., Milojevic-Dupont, N., Ramakrishnan, A., Sethi, M., Fouquet, R., & Ürge-Vorsatz, D. (2022). Fair urban mitigation. Nature Climate Change. https://www.nature.com/articles/s41558-022-01349-1
Acheampong, R. A., Silva, E. A. (2021). Land-use transport models for climate change mitigation and adaptation planning. Journal of Transport and Land Use. https://www.jtlu.org/index.php/jtlu/article/view/1209
Cao, J. (2021). Land Use and Transportation Policies Addressing Climate Change. SSRN. https://papers.ssrn.com/sol3/papers.cfm?abstract_id=3940681
ITDP (2021). The Compact City Scenario – Electrified: How Electrification, Public Transport, and Urban Form Reduce Urban Passenger Transport Emissions. Institute for Transportation and Development Policy. https://www.itdp.org/publication/the-compact-city-scenario-electrified
Cervero, R., Guerra, E., & Al, S. (2017). Beyond Mobility: Planning Cities for People and Places. Island Press. https://islandpress.org/books/beyond-mobility
Suzuki, H., Cervero, R., & Iuchi, K. (2013). Transforming Cities with Transit: Transit and Land-Use Integration for Sustainable Urban Development. World Bank. https://openknowledge.worldbank.org/entities/publication/3ac8baac-cd06-5e05-a1fa-1a14cd12c74b
Ewing, R., & Cervero, R. (2010). Travel and the Built Environment. Journal of the American Planning Association. https://doi.org/10.1080/01944361003766766
North Olympic Peninsula Resource Conservation & Development Council (n.d.). Transportation and Land Use – Climate Action Toolkit. North Olympic Peninsula RC&D. https://www.noprcd.org/climate-action-toolkit/transportation-and-land-use